|
For this lab exercise, we used ArcGIS Pro tools to compute spatial statistics on point vector data. We were interested in identifying hot spots and cold spots so to speak in the distribution of sasquatch sightings in North America. The first statistical analysis tool was calculating the "average nearest neighbor" which determines, for each point, the average distance to its nearest neighbor. The distribution of these values helps identify if the points are randomly distributed or subject to clustering and preference. The very high z-score and effectively zero p-value indicated clustered data. 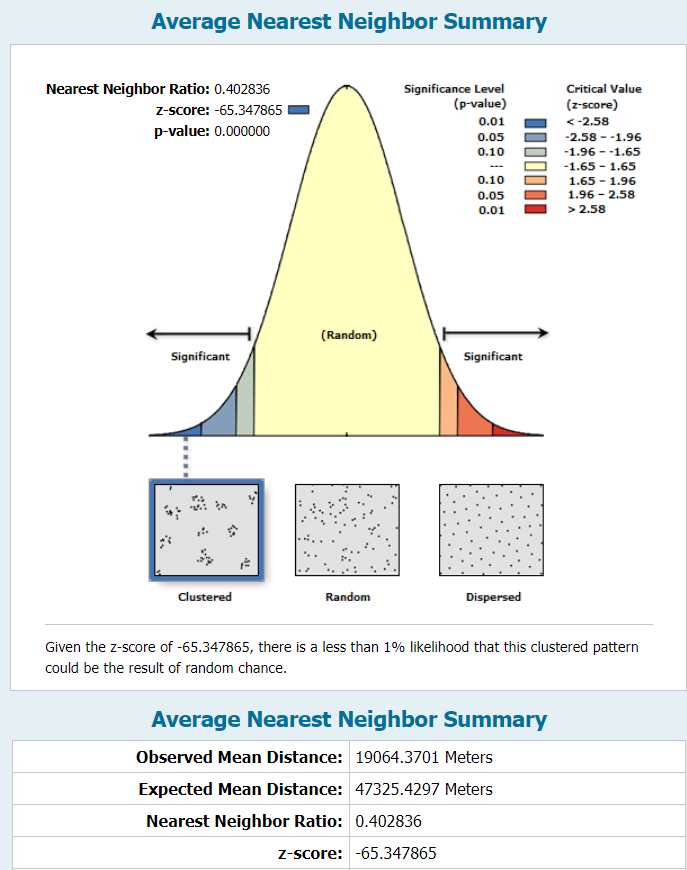 The second statistical analysis we performed was spatial autocorrelation using Moran's Index. This test is normalized on a scale of -1 to 1 and incorporates an attribute value for each point. The index determines whether there is spatial correlation of similar (or dissimilar, in the case of negative correlation) values to each other. For the sake of this exercise, we used a contrived attribute of "reliability," ranked on a scale of 1-5. The report below shows an I-value of 0.23, which represents slight correlation of similarly reliable sightings within certain areas. 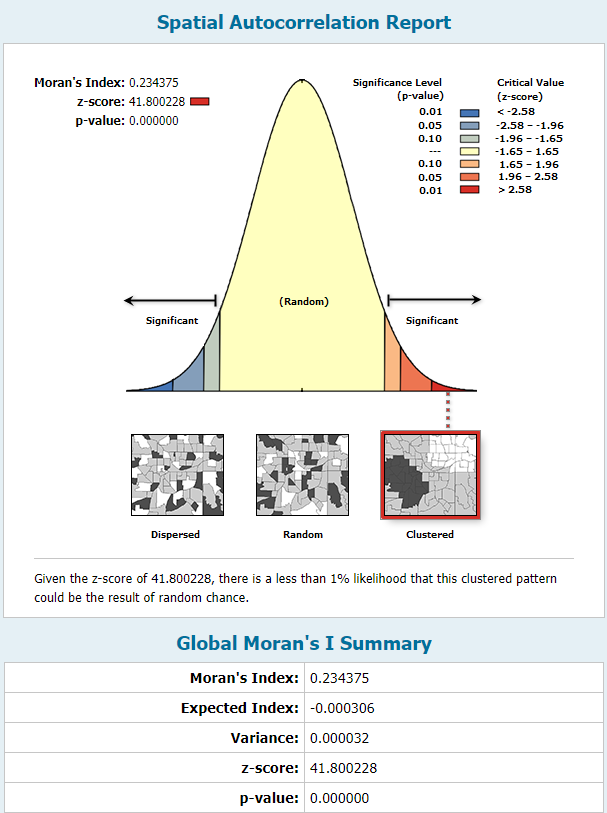 The final statistical test we conducted was the Gi* test, which uses the distribution of all values of the specified attribute to identify clusters of high values and clusters of low values. The "hotspot" values are assigned to a new set of points and a second shapefile is generated. The computation requires a user-defined search radius and the option for weighted significance based on distance between two points. I used fixed distances and compared the two results on the map below. Instead of applying the "reliability" field, I combined the sightings data with US Census Bureau county population data to create an attribute of local population density in the county of the sightings. The heat map indicates concentrated areas of sightings in densely populated areas as well as areas of clustered sightings in more rural areas. The search distance plays a significant role on the results, particularly well illustrated in the different treatment of sightings within the greater Seattle area. 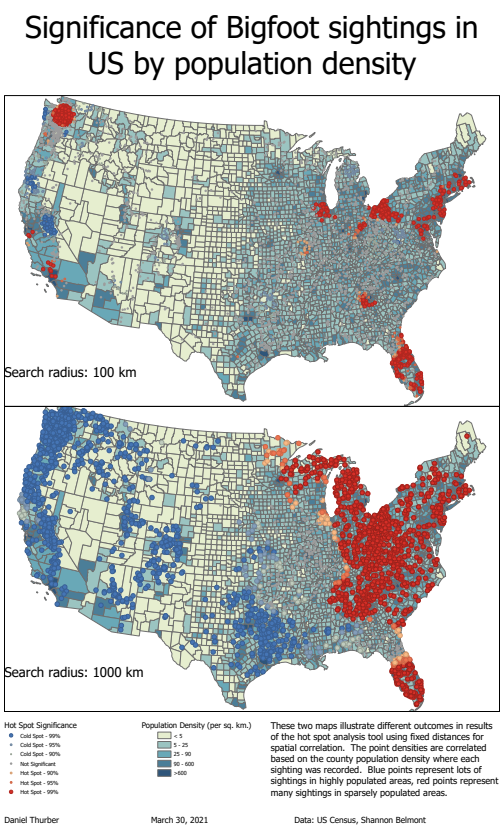 See a full-resolution PDF here
0 Comments
Leave a Reply. |
Advanced GISThis page is a repository of lab exercises produced for WATS 6920 - Advanced GIS Archives
April 2021
Categories |
 RSS Feed
