|
Following up with our previous analysis of digital elevation models, this week we went about creating DEM rasters from LiDAR point cloud data. Data from LiDAR surveys is a collection of millions of points (referred to as a point cloud) representing the elevation of the ground surface (or water surface/vegetation cover) throughout the survey area. We utilized Cloud Compare software to open and visualize the point cloud data. The data was then used to generate 1m resolution DEM grids. For any cells where no elevation points were measured, the elevation values were interpolated from different cells. The resulting grids were then displayed and processed using QGIS. QGIS is an open-source (free for most users) alternative to ESRI's ArcGIS Pro. Developing familiarity with this free alternative is useful for situations where one may not have access to more costly programs. The two maps show elevation overlaid with a hillshade layer. Note that the elevation color ramp covers the same relative relief (570 m) between the two maps. This entire range is fulfilled in the canyon near Klondike Creek, whereas the total relief near Spencer Reservoir is quite small. The absolute elevations of the two study areas are not correlated on this map. Horizontal scales of each are congruent. 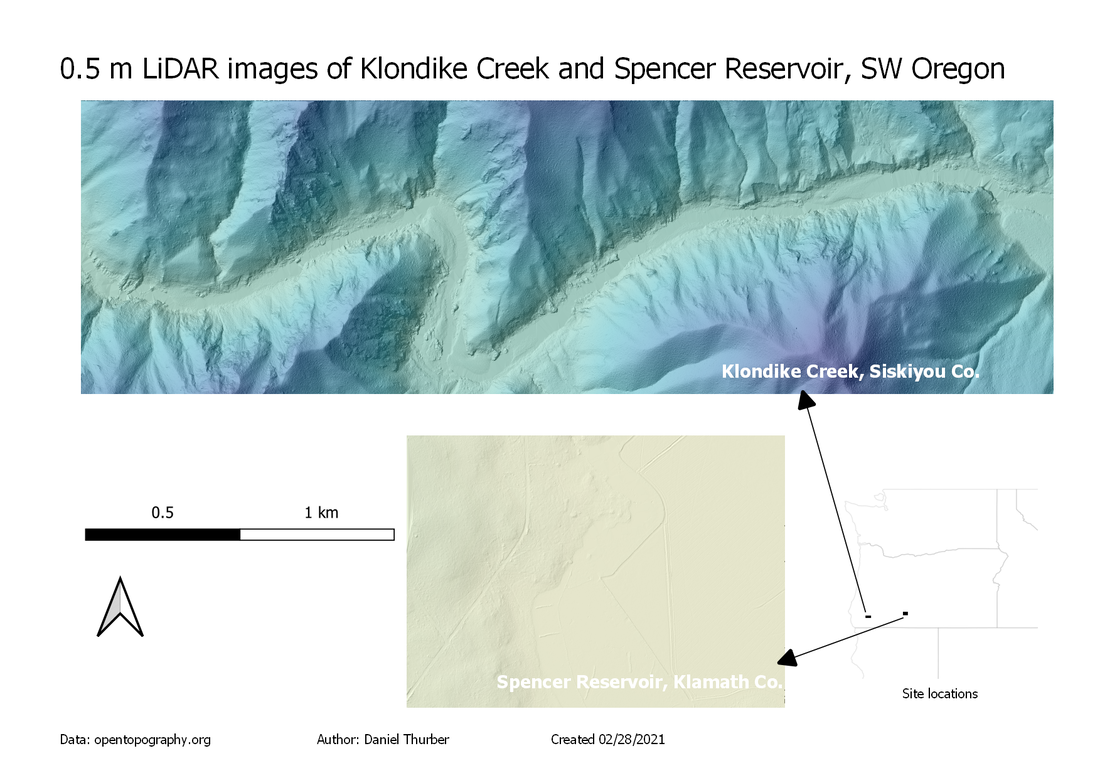 Find a full-resolution PDF here.
0 Comments
Leave a Reply. |
Advanced GISThis page is a repository of lab exercises produced for WATS 6920 - Advanced GIS Archives
April 2021
Categories |
 RSS Feed
